
Fareham grew by 165 people to 115,373 in the year to mid-2025, as deaths outnumbered births by 520. Its median age is now 48, against 40.6 for England.
Fareham borough had 115,373 residents in mid-2025, up just 165 in a year. More people died in the borough than were born in it. The only reason the population grew at all is that more people moved in from elsewhere in the UK than moved out.
The figures are the Office for National Statistics’ mid-2025 population estimates, the official count used to plan school places, GP services and council funding. They cover the year from July 2024 to June 2025.
Growth of 0.1% is a third of England’s rate. England grew by 0.4% over the same year, its slowest rise since 2020, the ONS says.
Where the change came from
The ONS breaks each year’s change into its parts. For Fareham, in the year to mid-2025:
| People | |
|---|---|
| Births | 799 |
| Deaths | 1,319 |
| Births minus deaths | minus 520 |
| Moved in from elsewhere in the UK | 6,522 |
| Moved out to elsewhere in the UK | 5,931 |
| Net move-ins from the UK | plus 591 |
| Arrived from abroad | 404 |
| Left for abroad | 444 |
| Net international migration | minus 40 |
| Other changes | plus 134 |
| Total change | plus 165 |
The “other” line is, in the ONS’s words, “changes to the size of armed forces stationed in the UK and other special population adjustments”.
Relative to its population, Fareham’s gap between deaths and births is one of the widest in the country. Only 34 of England’s 296 council areas had a bigger excess of deaths over births per head. The top three are Rother in East Sussex, North Norfolk and East Lindsey in Lincolnshire.
How Fareham compares with its neighbours
Fareham grew more slowly than most of its neighbours, and much more slowly than the districts to its north. Change in the year to mid-2025:
| Area | Population, mid-2025 | Change in a year |
|---|---|---|
| Winchester | 136,856 | +1,412 (1.0%) |
| Eastleigh | 143,710 | +1,032 (0.7%) |
| Havant | 127,362 | +568 (0.4%) |
| Fareham | 115,373 | +165 (0.1%) |
| Gosport | 82,618 | minus 109 (minus 0.1%) |
| Portsmouth | 211,475 | minus 1,461 (minus 0.7%) |
Over ten years the difference is starker. Fareham has grown by 893 people since mid-2015, or 0.8%. England grew by 7.3% over the same decade. Winchester grew by 12.7% and Eastleigh by 12.0%.
All the figures come from the ONS population tables for mid-2025 and the same series on Nomis.
An older borough every year
The headline number hides a big shift in who lives here. Since mid-2015:
- people aged 65 and over rose by 4,405 to 30,516, up 16.9%
- people aged 85 and over rose by 1,278 to 4,812, up 36.2%
- people of working age (16 to 64) fell by 2,498 to 66,631, down 3.6%
- children under 16 fell by 1,014 to 18,226, down 5.3%
- young adults aged 18 to 24 fell by 1,214 to 7,103, down 14.6%
More than one Fareham resident in four, 26.4%, is now 65 or over. Across England the figure is 19.1%.
The borough’s median age, the age at which half the population is older and half younger, was 48.0 in mid-2025. It was 45.7 in 2015. England’s is 40.6.
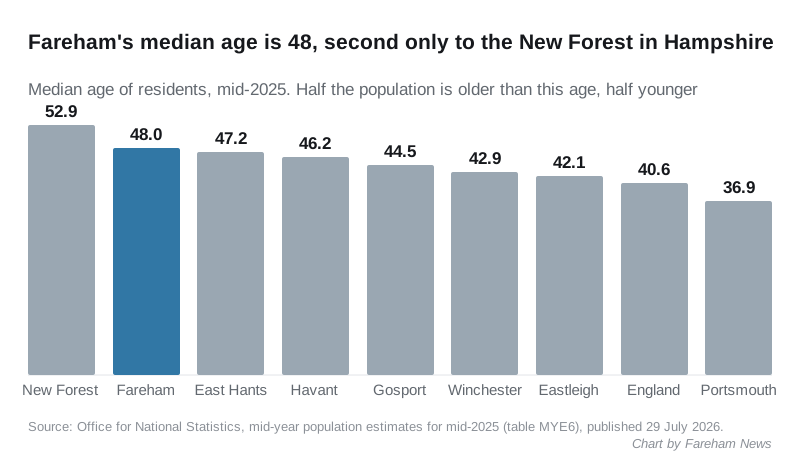
Of Hampshire’s eleven districts, only the New Forest, at 52.9, has an older median age. Fareham is the 43rd oldest of England’s 296 council areas. Portsmouth, next door, has a median age of 36.9.
What it means for you
- More demand for care and health services, fewer people of working age to staff them. The number of residents aged 85 and over has risen by more than a third in ten years.
- There are 1,014 fewer children under 16 than in 2015. Families choosing a school can check our Fareham school term dates page and the Henry Cort catchment change.
- Housing is where this could change. The borough’s population has barely moved in a decade. The council’s new Local Plan, which sets how many homes are built and where, is covered in our Local Plan 2044 consultation story. Our Fareham house prices page tracks what homes sell for.
- The next estimates, for mid-2026, are due from the ONS in summer 2027.
Sources
- Population estimates for England and Wales: mid-2025, Office for National Statistics, 29 July 2026.
- Estimates of the population for England and Wales, mid-2025 tables (MYE3 components of change, MYE5 population 2011 to 2025, MYE6 median age), Office for National Statistics.
- Population estimates, local authority based by single year of age, Nomis, for the age group figures for 2015 and 2025.
Have your say