
295 of Fareham's 1,335 claimants in September were aged 16 to 24, a 22% share, up from 17% three years ago. The borough rate held steady at 2.0% of 16 to 64s.
1,335 people were on the claimant count in Fareham borough in September, and 295 of them were aged 16 to 24. That is 22 per cent of the total, the largest share for young people in any September since 2020, when the pandemic swelled the count.
The borough total rose by 20 on August and by 20 on September 2025. Fareham’s rate held at 2.0 per cent of residents aged 16 to 64, as it has for most of the past year. The figures come from the Office for National Statistics release of 20 October, published through nomis.
The age mix is what has moved
The headline number has barely changed in a year. Who is in it has.
| Age group | September 2025 | September 2026 | Change |
|---|---|---|---|
| 16 to 24 | 275 | 295 | up 20 |
| 25 to 49 | 725 | 715 | down 10 |
| 50 and over | 310 | 325 | up 15 |
| All claimants | 1,315 | 1,335 | up 20 |
Comparing September with September takes out most of the school-leaver effect that lifts the count for young people every summer. On that basis the trend is clear.
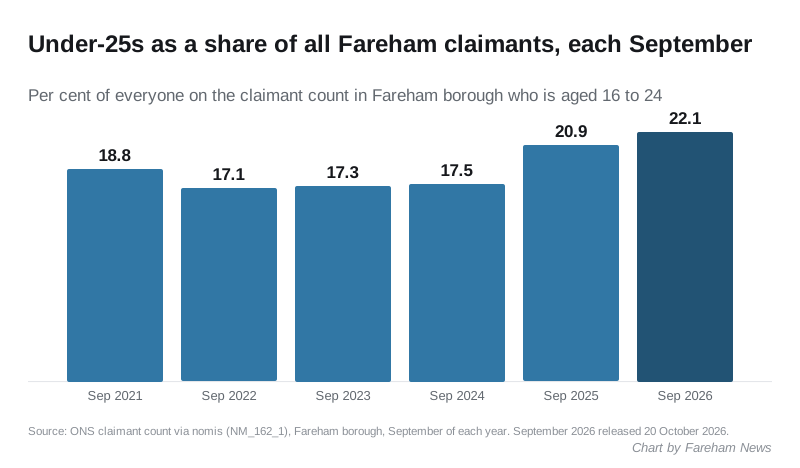
- September 2021: 310 under-25s out of 1,650, or 18.8 per cent
- September 2022: 210 out of 1,230, or 17.1 per cent
- September 2023: 200 out of 1,155, or 17.3 per cent
- September 2024: 235 out of 1,340, or 17.5 per cent
- September 2025: 275 out of 1,315, or 20.9 per cent
- September 2026: 295 out of 1,335, or 22.1 per cent
In 2021 the count was still falling from its pandemic peak, so the young-person share then reflected a much larger total. From 2022 to 2024 it sat at around 17 per cent. It has risen in each of the last two years.
August has been revised down
Last month we reported that 305 under-25s were claiming in August, the highest since September 2021, in a borough total of 1,345. The ONS has since revised both figures.
August now stands at 1,315 claimants, of whom 295 were under 25. The ONS warns that the most recent month in any release can move, because the Universal Credit data allows for revisions to the previous month. On the revised series the highest under-25 figure since 2021 is 300, in April 2026. September’s 295 matches August, March 2026 and December 2025.
So the young-person count has not set a new high. It has stayed close to 300 for most of this year, while it sat between 200 and 235 in every September from 2022 to 2024.
Where Fareham sits in Hampshire
Fareham’s rate is still among the lowest in the county.
| District | Rate, September 2026 | Claimants |
|---|---|---|
| Hart | 1.7% | 1,090 |
| Fareham | 2.0% | 1,335 |
| Test Valley | 2.0% | 1,610 |
| Winchester | 2.0% | 1,670 |
| East Hampshire | 2.2% | 1,640 |
| Eastleigh | 2.3% | 2,010 |
| New Forest | 2.3% | 2,250 |
| Basingstoke and Deane | 2.7% | 3,335 |
| Rushmoor | 3.0% | 2,095 |
| Havant | 3.3% | 2,415 |
| Gosport | 3.7% | 1,825 |
Gosport, next door, has the highest rate in Hampshire again, up from 3.6 per cent in August. The South East as a whole is at 3.1 per cent and England at 4.1 per cent.
What this number is
The claimant count is not the unemployment rate. The ONS defines it as people claiming Jobseeker’s Allowance, plus Universal Credit claimants who are required to look for work. That second group includes some people in low-paid work who must seek more hours.
The figures are not seasonally adjusted. Published counts are rounded to the nearest five, so the percentages above are worked out from rounded numbers.
What it means for you
- If you are under 25 and looking for work in Fareham, you are in a larger group than in any September from 2022 to 2024. Free careers advice for young people is available through the National Careers Service.
- If you employ people in the borough, there are about 60 more young jobseekers than in September 2024, when the figure was 235.
- If you are comparing Fareham with its neighbours, its rate is about half Gosport’s. Averages for “the Solent” hide that gap.
- Local vacancies are on our Fareham jobs page, and the other monthly measure of the local economy is on our Fareham house prices page.
The next monthly release may revise September’s figures.
Sources
- ONS claimant count via nomis, dataset NM_162_1, geography E07000087 (Fareham), the eleven Hampshire districts, the South East and England. Figures pulled 22 October 2026; nomis records the dataset as last updated at 07:00 on 20 October 2026. Counts are all claimants aged 16 and over, both sexes; rates are the proportion of residents aged 16 to 64.
- Claimant Count QMI, Office for National Statistics, for the definition and the revisions policy.
Have your say